
TL;DR: A memory dump contains the current state of a system’s physical memory at the time of its acquisition. Processes running on a system can share certain functionality provided by shared object files, which are represented internally by modules in Windows. However, each process only maps in its address space the functionalities it needs, and not the entire shared object file. In this way, current tools for extracting modules from existing processes in a memory dump of a Windows system obtain the partial content of the shared object files instead of the entire file. We have developed two tools, dubbed Modex and Intermodex, which allow a forensic analyst to extract a 64-bit module from one or more Windows memory dumps as completely as possible. To achieve this, they aggregate the contents of the same module loaded by multiple processes in the same memory dump or in different dumps. In addition, we also show how our tools are useful for detecting dynamic-link library (DLL) hijacking attacks. This post is a brief summary of our recently accepted paper at DFRWS EU 2023, “Module Extraction and DLL Hijacking Detection via Single or Multiple Memory Dumps”.
Introduction
Memory forensics is a sub-field of digital forensics that involves collecting a snapshot of the system in its current state (called a memory dump), which is then analyzed using appropriate tools such as Volatility. A DLL is a module that contains functions and data that other modules can use. In Windows terminology, a module is an executable or DLL file. When a Windows program runs, much of its functionality may be provided by one or more modules. For example, some programs may contain many different modules, and each program module is contained and distributed in DLL files. Using DLLs helps promote code modularization, code reuse, and efficient use of memory, among other benefits.
Multiple processes can load the same module into memory when the functionality provided by that module is needed. Due to memory usage optimization techniques, not all processes will map the entire module (or even the same parts of the module) in their address space: the pages (contiguous blocks of fixed-length virtual memory) mapped for a given process are those accessed by the process. Therefore, current tools for extracting modules from memory dumps are imprecise, since only the pages mapped into a single process address space are extracted.
With this shortcoming in mind, we have developed tools to get as much content as possible from a given module. In particular, our goal is to extract as complete a module as possible from a single memory dump (we called it intradump extraction) or from multiple memory dumps (interdump extraction). This extraction is particularly useful when a module is loaded by more than one process on the same machine, or by multiple processes running on different machines, as it allows a forensic analyst to get the running module as complete as possible even when the content of the device is encrypted. Note that although we have focused on modules from 64-bit DLLs, our tools are also valid for extracting modules from 64-bit executables.
Our contribution is twofold. First, we have developed two tools, Modex and Intermodex, to perform intradump and interdump extractions, respectively. Both tools are written in Python 3 and their source code is freely available as open source under the GNU/GPLv3 license. In particular, Modex is a Volatility 3 plugin, while Intermodex is a standalone tool that depends on Modex for its operation. Second, we have integrated the ability to detect DLL hijacking attacks as a feature in both tools. We also present the experimental evaluation of the tools to validate them.
Modex and Intermodex
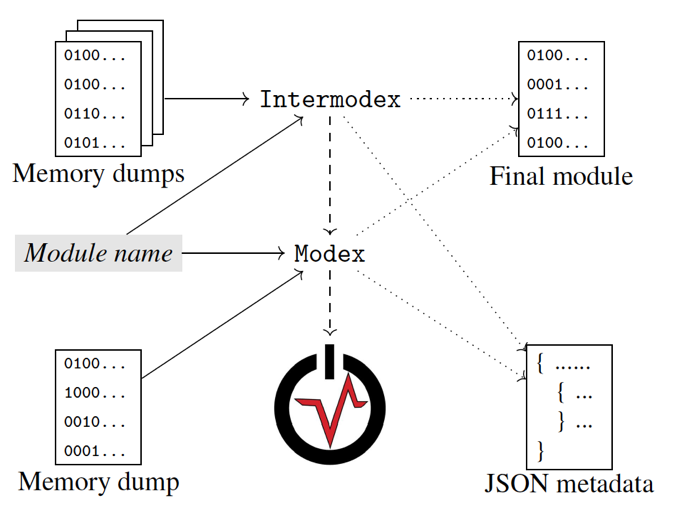
Figure 1 contains a high-level diagram of the two tools we have developed and their relationships to each other and to Volatility 3.
Modex
Modex is a Volatility 3 plugin implemented in Python 3 and designed to extract a 64-bit Windows module from a memory dump as completely as possible. This plugin takes the memory dump path and the module name as arguments and generates a directory containing several files: a file with the .dmp extension (corresponding to the extracted module with as many pages as possible), a JSON file containing metadata about the extracted module, and a log file with information about the execution of the tool. The JSON file contains, among other data, all processes where the extracted module was loaded, and for each extracted page it includes its offset and whether it was a shared or private page.
The extraction of a module is as follows. Modex walks through all the processes in the memory dump and checks which ones loaded the module supplied as an argument. When loaded into a process, the module is dumped, getting as many (intermediate) .dmp files as processes the module was loaded into. Finally, it combines all those intermediate dump modules into a single .dmp file (we called it the final module).
Intermodex
Intermodex is a tool written in Python 3 also with the goal of extracting as complete a module as possible, but using multiple memory dumps. This type of extraction can be useful for extracting a malicious DLL deployed on some workstations in a corporate environment that is centrally managed by the organization.
It accepts as arguments the path to a directory where various memory dumps are located and the name of the module to extract. Since we currently cannot handle multiple dumps at once from Volatility, we have implemented this tool as a separate tool but using Modex underneath. To perform extraction across multiple memory dumps, Intermodex first uses Modex to extract the module given as the argument from each memory dump and then combines all these extracted modules appropriately.
As before, the output of Intermodex consists of three files: a .dmp file that represents the combined module, metadata in JSON format, and an execution log file. Intermodex also offers the option of performing a derelocation process on the extracted module, to make it more similar to the file on disk.
Note that the memory dumps provided to Intermodex may be from the same machine or from different machines. However, when they are from different machines, the extraction will make sense if those machines have a similar configuration (so that the same versions of the modules are combined).
Experiments
Here, we first describe the methodology followed to carry out the experiments. Subsequently, we present and discuss the results obtained.
Methodology
For the Modex and Intermodex evaluation, we have used a virtual machine running Windows 10 (64-bit, Pro edition, version 21H2) with 8 GiB of RAM on top of the VirtualBox virtualization software. We use Windows 10 because it is the most popular version of Windows today. We installed four applications on that machine: a web browser (Google Chrome), a word processor (Microsoft Word), a PDF reader (Adobe Acrobat Reader DC), and a spreadsheet processor (Microsoft Excel). We have selected these types of programs because they are the most used and these applications in particular because they are the most popular in their respective categories.
In this virtual machine we simulate the usual behavior of the users, performing a memory dump and shutting down the machine after each simulation. This simulation is done manually, since we did not find any tool that would fit our purposes without investing a considerable amount of time. To simulate user activity, we perform the following steps: (1) power on the machine; (2) open Google Chrome and use its search engine to find three popular news websites, visiting them, scrolling through them, and viewing some news articles; (3) open Microsoft Word and create a document that includes text and images; (4) view and navigate multiple PDF files with Adobe Acrobat Reader DC; and (5) open Microsoft Excel and insert some data into a spreadsheet. Each application is used for 5 minutes. These steps are repeated twice, defining two experimental scenarios. The first time we do not close the applications after using them, while the second time we explicitly close them.
As objects for the experiment measurements, we select a subset of DLLs that are loaded by all the applications we choose for the experiments (in particular, and sorted in decreasing order of size: ntdll.dll, user32.dll, ole32.dll, kernel32.dll, advapi32.dll, and gdi32.dll).
We collect a memory dump after each step in both scenarios (for a total of 10 memory dumps). For each DLL and scenario, we first run Modex on the first memory dump (obtained after the first step). Next, we run Intermodex on the first and second memory dumps, then Intermodex on the first, second, and third, and so on until we consider all five memory dumps for each scenario.
Results and Discussion
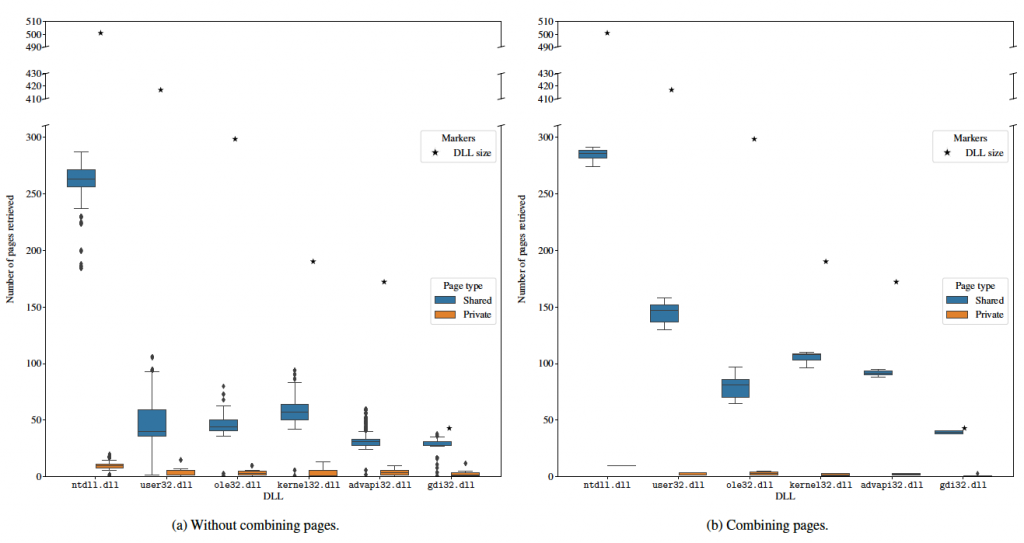
To evaluate the performance of the Modex tool we first calculate the number of pages retrieved for the DLLs in the processes where they were loaded, without merging any pages. The results of these intermediate dumped modules are depicted in Figure 2a. We explicitly mark in this graphic the size of each module (in small pages). We only found small pages (i.e., 4 KiB) in all the experiments we ran. These results reflect the fact that, for any given process, only the pages mapped on its address space can be retrieved. Also, the number of shared pages is greater than the number of private pages for all modules, which is an expected result since DLLs are designed to be shared between different processes.
Figure 2b shows the number of pages retrieved, but after combining the intermediate dumped modules with the Modex tool. As before, we explicitly marked in this graphic the size of each module (in small pages). As shown, the combined modules contain more pages in all cases. Also, the number of private pages decreases when modules are combined, since shared pages take precedence over private ones. As a result, the resulting final modules have fewer private pages. As a conclusion, our findings show that intradump extraction allows to obtain more complete modules than if they are extracted from individual processes.
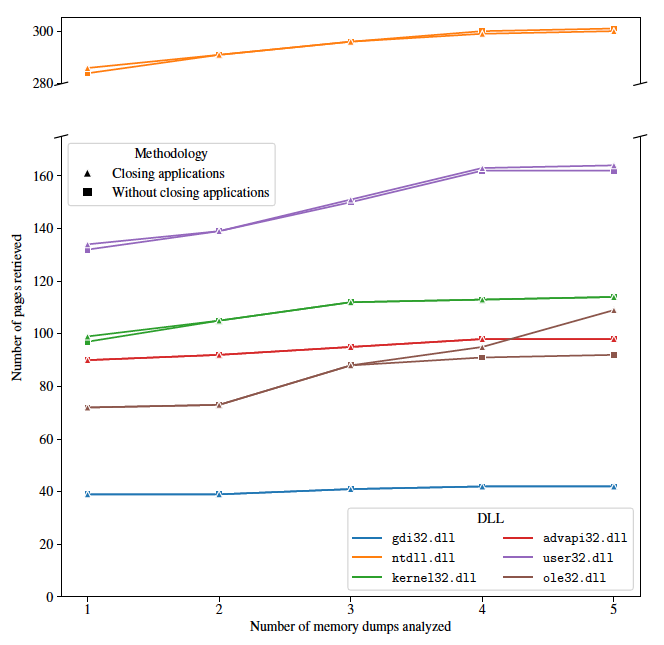
Next, we evaluate the performance of the Intermodex tool. The evolution of the recovered pages in both scenarios when more memory dumps are taken into account is shown in Figure 3. Regardless of the scenario, the number of pages retrieved increases when more memory dumps are considered. Recall that in our experiments, each new dump contains a new running application. Therefore, when a new application is started it is likely to use some functions of the DLL that others do not, thus loading these pages that were not in memory before. In general, the results in both scenarios are very similar, with small variations in the number of pages.
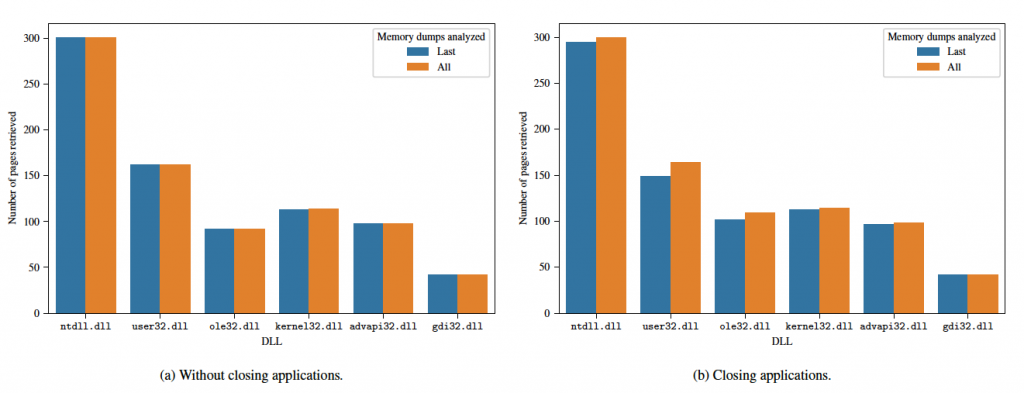
Finally, we compare the number of pages retrieved in both scenarios when considering only the last memory dump or when considering all memory dumps. The results are plotted on Figure 4. In the first scenario, there is practically no difference as the same content was in memory in both situations because the applications were not closed. These results may vary on systems with restricted RAM and a large number of running applications, since not all program content will fit into RAM when more programs are launched and the operating system will swap.
In the second scenario, considering more memory dumps is clearly beneficial. As shown in Figure 4b, the number of pages retrieved is higher considering all memory dumps than just the last memory dump, particularly for the ntdll.dll, user32.dll, and ole32.dll DLLs. As we expected these differences to be larger, we performed a manual inspection of the memory dumps and found that some processes (particularly the Google Chrome and Adobe Acrobat Reader DC application processes) continued to run in the background even though the user had closed the application windows.
DLL Hijacking Detection
Here, we first describe how the built-in feature in Modex and Intermodex works to detect DLL hijacking attacks. We then validate it through a proof of concept.
Detection Method
DLL hijacking attacks can be detected using Modex and Intermodex with the –detect flag. When this argument is given, our tools try to detect if the module given as an argument has been hijacked and no modules are extracted, since the goal is to detect DLL hijacking techniques. In this case, the JSON file provided as output contains information about the detection of DLL hijacking techniques. When a DLL hijacking attack is detected, Modex indicates affected processes, while Intermodex also indicates affected memory dumps.
Detection of DLL hijacking techniques is as follows. First we list all processes that have the module given as an argument loaded into their address space. We then check the module path and size in each of these processes. We consider the actual path and size of the module to be the most common for all modules identified above. This allows us to detect both the loading of modules with the same name but different paths, as well as modules in the same path but different sizes. Consequently, we define a potential DLL hijacking case when at least one path is different from the most common path or at least one size is different from the most common size. A disadvantage of this approach is that it will not detect this attack when the paths and sizes of the malicious DLL and the legitimate DLL match.
Proof of Concept
To test this functionality, we have created a DLL hijacking Proof of Concept (PoC). In particular, we have used the DLL proxying technique. The chosen victim application is VLC media player, which is a popular free and open source media player. The DLL we are targeting is cryptbase.dll, which is loaded by VLC media player as well as other processes, and is not on the list of known DLLs.
Our malicious DLL is placed in the same directory as VLC media player to make it easier to load when the application runs. When executed, it simply opens a command shell window when the DLL is loaded, and all legitimate functions of cryptbase.dll are proxied appropriately. After running VLC media player and verifying that our malicious DLL is loaded, a memory dump of the machine is acquired (Infected Dump). We also acquired a memory dump when the application was running without our PoC (Clean Dump).
Running Modex in Infected Dump successfully detected our PoC, giving the process identifier (PID) of the VLC media player process as suspicious:
{
    "memory_dump_location": "file:///tmp/MemoryDumps/InfectedDump.elf",
    "mapped_modules": [
        ...
    ],
    "dll_hijacking_detection_result": true,
    "suspicious_processes": [
        3208
    ]
}
Similarly, running Intermodex in Infected Dump and Clean Dump also successfully detected our PoC, marking the same PID as suspicious and Infected Dump as the dump where the suspicious process was running:
{
    "dll_hijacking_detection_result": true,
    "suspicious_processes": {
        "file:///tmp/MemoryDumps/InfectedDump.elf": [
            3208
        ]
    }
}
The detection is successful because neither the malicious module’s path nor its size match the values of the original module.
Using a technique such as DLL proxying like the one we used in our PoC, threat actors can hide their malicious code behind a popular and legitimate process and give the impression that it is a common library. Also, the library used in this PoC (cryptbase.dll) is signed by Microsoft, so it does not look suspicious to the naked eye. Therefore, we believe that being able to detect DLL hijacking techniques can be valuable in a forensic investigation.
And that’s all, folks! In this blog post we have summarized our paper titled “Module Extraction and DLL Hijacking Detection via Single or Multiple Memory Dumps”, presented at DFRWS EU 2023. In the paper you can find a more detailed explanation of the tools we created and the experiments we carried out. Feel free to download and use the tools we developed! Thanks for reading!